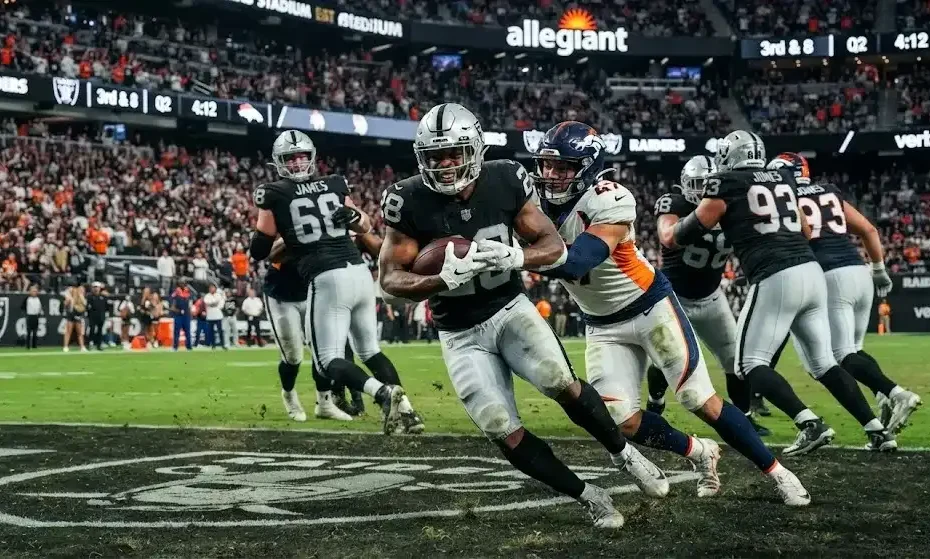
You want the Las Vegas Raiders vs Denver Broncos match player stats, and you want them fast. Instead, you find box scores spread across five sites, each with a different layout. The numbers clash, the tables hide the story, and you still can’t tell who really controlled the game. This guide fixes that by putting every key stat, every turning point, and the rivalry context in one place.
These Las Vegas Raiders vs Denver Broncos match player stats come from the most recent completed meeting: Denver’s 24–17 win on Dec. 7, 2025. Every number comes from official box scores and game recaps. You also get a head-to-head comparison and the latest team updates.
A Quick Look at the Rivalry
The Broncos and Raiders have played each other since 1960. Denver won the first meeting 31–14 on Oct. 2, 1960. Since then, the Raiders have built a 73–58–2 lead in the all-time series.
The rivalry has produced two playoff games. The Broncos won the 1977 AFC Championship Game 20–17. The Raiders answered with a 42–24 win in the 1993 AFC Wild Card round.
Recent history favors Denver. The Broncos swept the Raiders in 2024 and again in 2025, which gives them four straight wins in the series. Pro Football Reference keeps the full box score for the latest game if you want to check any number yourself. That history sets the backdrop for the Las Vegas Raiders vs Denver Broncos match player stats below.
Head-to-Head Comparison: Raiders vs Broncos at a Glance
This table puts both franchises side by side. Use it as your quick reference before you read the Las Vegas Raiders vs Denver Broncos match player stats.
| Category | Las Vegas Raiders | Denver Broncos |
|---|---|---|
| All-time series wins | 73 | 58 (plus 2 ties) |
| Biggest win | 51–0 (1967) | 44–7 (1962) |
| Most points in one game | 59 (2010) | 47 (2014) |
| Longest win streak | 14 games (1965–1971) | 8 games (2011–2015) |
| Playoff result | Won 1993 Wild Card, 42–24 | Won 1977 AFC title game, 20–17 |
| Week 10, 2025 (Thursday night) | Lost 10–7 | Won 10–7 |
| Week 14, 2025 | Lost 24–17 | Won 24–17 |
The second 2025 game looked closer on the scoreboard than it played. Denver gained 356 yards to the Raiders’ 229, and Las Vegas needed two late scores to make the final margin respectable.
The Most Recent Matchup: Broncos 24, Raiders 17 at Allegiant Stadium
The most recent completed game between these teams took place on Sunday, Dec. 7, 2025, at Allegiant Stadium. Denver arrived at 10 straight wins and a 10–2 record. Las Vegas arrived at 2–10 and had lost six in a row.
The stakes favored Denver. The win moved the Broncos to 11–2, put them back on top of the AFC, and gave them a tiebreaker edge. Statistics also pointed to a mismatch: Denver brought a top-five defense against a Raiders offense that ranked at or near the bottom in several categories.
The crowd leaned orange, and Broncos fans got a game they could enjoy from the opening drive. The Las Vegas Raiders vs Denver Broncos match player stats below show how Denver built that comfort.
| Team | Q1 | Q2 | Q3 | Q4 | Final |
|---|---|---|---|---|---|
| Denver Broncos | 7 | 7 | 7 | 3 | 24 |
| Las Vegas Raiders | 7 | 0 | 0 | 10 | 17 |
Las Vegas Raiders vs Denver Broncos Match Player Stats: Team Totals and Efficiency Comparison
Team totals show how the game really looked, and they frame every other number. The Broncos won the yardage battle by 127 yards and the clock battle by more than 18 minutes.
| Team Stat | Denver Broncos | Las Vegas Raiders |
|---|---|---|
| Final score | 24 | 17 |
| Total yards | 356 | 229 |
| First downs | 27 | 16 |
| Rushing | 31 carries, 152 yards (4.9 avg) | 12 carries, 40 yards (3.3 avg) |
| Passing | 31 of 38, 212 yards | 21 of 32, 213 yards |
| Sacks allowed | 3 | 4 |
| Turnovers | 0 | 0 |
| Time of possession | 39:03 | 20:57 |
| Field goals | 1 of 1 (23 yards) | 1 of 1 (46 yards) |
| Punt returns | 1 for 48 yards, 1 TD | None |
Three takeaways stand out. The teams threw for almost the same yardage, so the passing game did not decide this one. Denver ran the ball 31 times to Las Vegas’s 12, which shows who owned the line of scrimmage. Neither team turned the ball over, so Denver won on execution, not gifts.
Complete Quarterback Matchup and Passing Stats
Three quarterbacks played, and the passing line is where the Las Vegas Raiders vs Denver Broncos match player stats surprise you most. Smith left late in the third quarter with a right shoulder injury, and Pickett finished the game.
| Quarterback | Comp/Att | Comp % | Yards | Yds/Att | TD | INT | Passer Rating |
|---|---|---|---|---|---|---|---|
| Bo Nix (DEN) | 31/38 | 81.6 | 212 | 5.6 | 0 | 0 | 89.9 |
| Geno Smith (LV) | 13/21 | 61.9 | 116 | 5.5 | 1 | 0 | 92.6 |
| Kenny Pickett (LV) | 8/11 | 72.7 | 97 | 8.8 | 1 | 0 | 129.7 |
Nix completed 81.6 percent of his passes, but he averaged only 5.6 yards per attempt. Denver’s longest catch of the day covered just 15 yards, so the offense moved in short, steady bites. Nix also ran for a touchdown on three carries for 15 yards, and Denver sacked him three times.
Smith opened strong. He led a 10-play, 70-yard drive and hit tight end Brock Bowers for a 15-yard touchdown on the last play of the first quarter. After that, the Broncos pressured him all afternoon, and the Raiders found little rhythm until Pickett entered.
Pickett produced the best passer rating of the day in limited work. His 25-yard touchdown pass to Shedrick Jackson came in garbage time, but it showed the Raiders could stretch the field when the pocket held.
Rushing Leaders and Ground Game Performance
The Las Vegas Raiders vs Denver Broncos match player stats show the ground game separated these teams more than any other category. Denver spread carries across five players. Las Vegas could not find a lane.
| Broncos Rusher | Carries | Yards | Avg | TD | Long |
|---|---|---|---|---|---|
| RJ Harvey | 17 | 75 | 4.4 | 1 | 15 |
| Jaleel McLaughlin | 4 | 22 | 5.5 | 0 | 11 |
| Adam Prentice | 2 | 22 | 11.0 | 0 | 18 |
| Tyler Badie | 4 | 16 | 4.0 | 0 | 7 |
| Bo Nix | 3 | 15 | 5.0 | 1 | 8 |
| Raiders Rusher | Carries | Yards | Avg | TD | Long |
|---|---|---|---|---|---|
| Ashton Jeanty | 10 | 30 | 3.0 | 0 | 6 |
| Kenny Pickett | 1 | 6 | 6.0 | 0 | 6 |
| Geno Smith | 1 | 4 | 4.0 | 0 | 4 |
Harvey carried the load with 17 attempts and a 3-yard touchdown in the third quarter. Prentice made the biggest explosive play on the ground with an 18-yard run. The Raiders’ longest rush went for six yards, so Jeanty never had room to build momentum.
Receiving Production and Target Breakdown
Denver completed passes to 11 different players. In the receiving Las Vegas Raiders vs Denver Broncos match player stats, Las Vegas leaned on a smaller group but gained more yards per catch.
| Broncos Receiver | Targets | Catches | Yards | Long | TD |
|---|---|---|---|---|---|
| Courtland Sutton | 10 | 6 | 62 | 14 | 0 |
| Pat Bryant | 4 | 4 | 32 | 13 | 0 |
| Lil’Jordan Humphrey | 3 | 3 | 27 | 15 | 0 |
| RJ Harvey | 6 | 6 | 25 | 9 | 0 |
| Adam Trautman | 2 | 2 | 17 | 12 | 0 |
| Troy Franklin | 4 | 3 | 11 | 6 | 0 |
| Raiders Receiver | Targets | Catches | Yards | Long | TD |
|---|---|---|---|---|---|
| Jack Bech | 6 | 6 | 50 | 17 | 0 |
| Brock Bowers | 5 | 4 | 46 | 15 | 1 |
| Tyler Lockett | 4 | 3 | 41 | 26 | 0 |
| Shedrick Jackson | 1 | 1 | 25 | 25 | 1 |
| Tre Tucker | 5 | 2 | 24 | 13 | 0 |
| Ian Thomas | 2 | 2 | 17 | 12 | 0 |
Sutton saw 10 targets, four more than any other Denver receiver, and Harvey caught all six of his passes out of the backfield. Bech caught all six of his targets for Las Vegas. Tucker caught only two of his five.
Red-zone chances told the story for the Raiders. Bowers scored from 15 yards out in the first quarter. Later, with Pickett at quarterback, Las Vegas faced fourth-and-goal from the 5 and failed to convert a pass to Bowers.
Defensive Plays, Turnovers, and Sacks
Neither defense forced a turnover, so the defensive Las Vegas Raiders vs Denver Broncos match player stats come down to pressure and tackling. Denver sacked the Raiders four times and recorded five tackles for loss. Las Vegas sacked Nix three times and recorded four tackles for loss.
| Broncos Defender | Tackles | Sacks | TFL | Pass Breakups |
|---|---|---|---|---|
| Alex Singleton | 8 | 0 | 0 | 0 |
| Talanoa Hufanga | 5 | 0 | 0 | 0 |
| Riley Moss | 5 | 0 | 0 | 0 |
| Nik Bonitto | 3 | 2 | 2 | 0 |
| Malcolm Roach | 2 | 1 | 1 | 0 |
| John Franklin-Myers | 2 | 1 | 1 | 0 |
| Patrick Surtain II | 3 | 0 | 0 | 1 |
| Raiders Defender | Tackles | Sacks | TFL | Pass Breakups |
|---|---|---|---|---|
| Devin White | 19 | 0 | 0 | 0 |
| Jeremy Chinn | 11 | 1 | 0 | 0 |
| Eric Stokes | 9 | 0 | 0 | 0 |
| Darien Porter | 6 | 0 | 0 | 2 |
| Maxx Crosby | 4 | 1 | 2 | 0 |
| Tonka Hemingway | 1 | 1 | 1 | 0 |
Which Defensive Numbers Stood Out Most?
Devin White’s 19 tackles top the list, but the number reflects Denver’s 39 minutes of possession more than elite play. Bonitto’s two sacks and two tackles for loss changed more drives. Crosby’s two tackles for loss pushed his season total to 25, which broke the team record of 23 he set three years earlier.
Step-by-Step Game-Changing Moments
Each moment below moved the scoreboard or the odds, and each one shows up in the Las Vegas Raiders vs Denver Broncos match player stats. Read them in order and you can follow the entire game.
- Denver’s opening march. The Broncos drove 14 plays and 81 yards, ate nearly nine minutes, and scored on a Nix touchdown run. The lead was 7–0.
- Vegas answers. Smith led a 10-play, 70-yard drive and hit Bowers for a 15-yard touchdown on the final play of the quarter. The score was 7–7.
- The Mims punt return. With 6:29 left in the half, Marvin Mims Jr. returned a punt 48 yards for a touchdown. It gave Denver a 14–7 lead and was the first punt-return touchdown of his career.
- The 91-yard drive. Denver chewed up more than nine minutes on a 91-yard march that ended with Harvey’s 3-yard touchdown run. The score was 21–7.
- Smith leaves. The Raiders reached third-and-goal at the Denver 7, but Smith hurt his right hand and shoulder late in the third quarter. Pickett failed to convert a fourth-and-goal pass.
- The 19-play dagger. Denver answered with a 19-play, 90-yard drive that ended with Wil Lutz’s 23-yard field goal. The Broncos led 24–7 with under four minutes left.
- Garbage-time scoring. Pickett found Jackson for a 25-yard touchdown with 2:17 left. Jackson made his first NFL touch on the play. Daniel Carlson added a 46-yard field goal at the buzzer.
What the Numbers Tell Us About Each Team
Here is what the Las Vegas Raiders vs Denver Broncos match player stats say, position by position.
Quarterback. Nix kept the offense on schedule but did not threaten defenses downfield. Smith and Pickett combined for 213 passing yards and two touchdowns, so the Raiders’ quarterback play was not the main problem.
Running back. Harvey and the Denver committee gained 152 yards and kept the chains moving. Jeanty finished with 30 yards on 10 carries, and the Raiders never established a ground threat.
Receivers and tight ends. Denver’s receivers caught 31 passes without a big play. Las Vegas turned 21 catches into 213 yards, and Lockett’s 26-yard catch was the longest of the afternoon.
Pass rush. Bonitto, Roach, and Franklin-Myers gave Denver four sacks. Crosby, Chinn, and Hemingway gave the Raiders three, so the defensive lines traded blows evenly.
Special teams. Mims’s punt return was the single biggest swing. The Raiders punted well, with A.J. Cole averaging 47.7 yards on three kicks, but the return touchdown erased that edge.
Looking Back: How the Rivalry Has Unfolded Over Time
Today’s players inherit a long history. On Oct. 16, 1977, the 4–0 Broncos beat the 4–0 Raiders in Oakland and ended Oakland’s 17-game winning streak. Raiders quarterback Ken Stabler threw seven interceptions in that game.
Playoff drama followed. Before the 1993 Wild Card game, Raiders owner Al Davis said Denver was “scared to death of us.” The Raiders won 42–24.
The scoring records show how wild the series can get. The Raiders hit 59 points in 2010, and the Broncos hit 47 in 2014. Modern stars such as Maxx Crosby and Bo Nix now write the next chapters.
Why Player Stats Matter in This Matchup
A 24–17 result looks competitive, but the player stats show a Denver team that controlled the line, the clock, and the field.
Individual numbers also predict the next meeting. If Jeanty gets only 3.0 yards per carry again, the Raiders will need their quarterback to carry the offense. If Denver again completes nothing longer than 15 yards, the Broncos will rely on special teams and defense to create separation.
The Las Vegas Raiders vs Denver Broncos match player stats also reveal roster depth. Denver used 11 receivers and five rushers. Las Vegas lost its starting quarterback during the game.
Latest Updates Before the Next Meeting
The teams meet twice in 2026. The first game takes place in Week 11 in Denver, and the second comes in Week 15 at Allegiant Stadium on Dec. 20.
The Raiders have a new look. Klint Kubiak coaches the team in his first season, and Las Vegas drafted quarterback Fernando Mendoza with the No. 1 overall pick. Veteran Kirk Cousins still sits ahead of Mendoza on the depth chart.
Running back Ashton Jeanty and tight end Brock Bowers remain the headline names on offense. NFL.com’s AFC West preview covers the roster changes in detail.
The Broncos won the AFC West at 14–3 in 2025, but Nix broke his right ankle late in the Divisional Round win over Buffalo. He had two offseason surgeries and returned in the preseason, where he went 6 of 9 for 76 yards and a touchdown. Nix has admitted the mental side of the comeback has taken time, and analysts have criticized his play since his return.
Check each team’s injury report before kickoff. Quarterback health changes every one of the Las Vegas Raiders vs Denver Broncos match player stats in this guide.
Final Thoughts and Fan Community Takeaways
The Las Vegas Raiders vs Denver Broncos match player stats from Dec. 7, 2025, tell a clear story. Denver won with patience, depth, and a defense that never lost control. Las Vegas stayed in reach with a strong opening drive and a late rally, but it never solved the pass rush or the running game.
Bookmark this page and use it as your baseline for the two 2026 meetings. Watch five numbers: Denver’s yards per pass attempt, Jeanty’s yards per carry, sacks on each side, time of possession, and special teams returns. If you want the full play-by-play, ESPN’s game page has every drive and every box score line.
Featured Match Guides
NFC Rivalry · Player Stats, Highlights & Key Performers
NFC North Battle · Stats & Game Analysis
Interconference Clash · Player Stats & Recap
NFC South Showdown · Stats & Top Performers
NFC South Rivalry · Player Stats & Highlights
NFC South Classic · Stats & Game Breakdown
NFC East Rivalry · Player Stats & Key Moments
Cross-Division Matchup · Stats & Analysis
AFC vs NFC · Player Stats & Game Recap